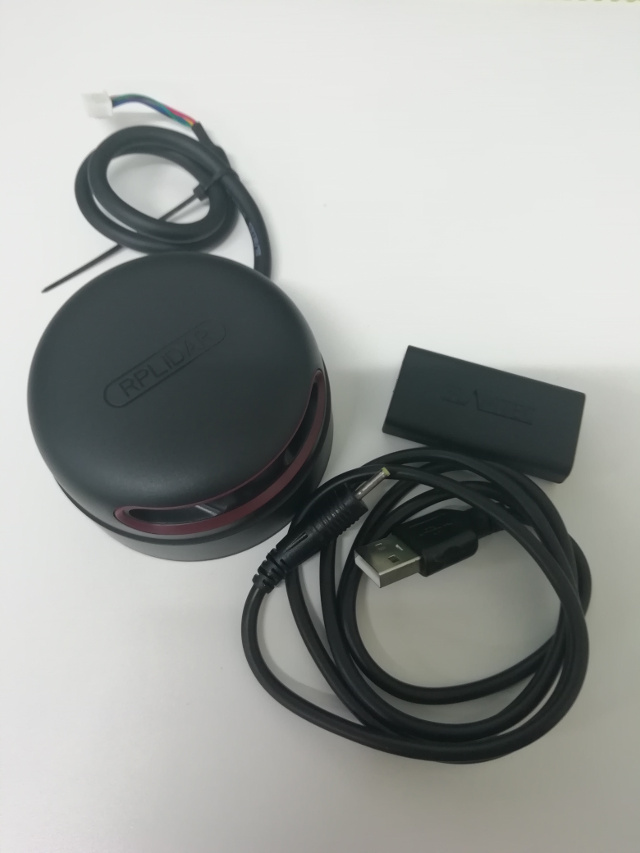
RPLIDAR A2を入手しました。
A3ではないのはまずはお試ししたかったので・・・
SDKを次のURLからダウンロードします。
https://github.com/slamtec/rplidar_sdk
SDKにサンプルアプリがあるのでビルドして実行します。
$ git clone https://github.com/slamtec/rplidar_sdk
$ cd rplidar_sdk/sdk
$ make
$ ./output/Linux/Release/ultra_simple /dev/ttyUSB0実行するとコンソールに表示されます。
   theta: 289.23 Dist: 00000.00 Q: 0
   theta: 290.00 Dist: 00502.00 Q: 47
   theta: 290.12 Dist: 00000.00 Q: 0
   theta: 291.14 Dist: 00461.00 Q: 47
   theta: 293.45 Dist: 00573.00 Q: 47
   theta: 294.11 Dist: 00581.00 Q: 47
   theta: 295.12 Dist: 00576.00 Q: 47
   theta: 295.91 Dist: 00571.00 Q: 47
   theta: 296.80 Dist: 00576.00 Q: 47
   theta: 297.70 Dist: 00593.00 Q: 47
   theta: 298.58 Dist: 00601.00 Q: 47
   theta: 299.47 Dist: 00601.00 Q: 47
   theta: 300.36 Dist: 00599.00 Q: 47
   theta: 301.38 Dist: 00598.00 Q: 47
   theta: 302.14 Dist: 00596.00 Q: 47
   theta: 303.05 Dist: 00599.00 Q: 47
   theta: 303.80 Dist: 00630.00 Q: 47
   theta: 304.41 Dist: 00000.00 Q: 0
   theta: 304.69 Dist: 00641.00 Q: 47
   theta: 305.31 Dist: 00000.00 Q: 0
   theta: 305.45 Dist: 00647.00 Q: 47
theta: 307.48 Dist: 00912.00 Q: 47 取得したデータを整形して表示してみました。
良いコードとは言えないけど、まぁ、適当に・・・
#!/usr/bin/python3

import re
import math

file = "test.dat"

f = open(file, 'r')
line = f.readline()

while line:
    line = line.strip()
    m = re.search("theta: ([0-9\.]+) Dist: ([0-9\.]+) Q: ([0-9]+)", line)
    s = float(m.group(1))
    c = float(m.group(2))
    r = s * math.pi /180
    a = c * math.sin(r)
    b = (-1.0) * c * math.cos(r)
    print(str(a) + " " + str(b) + " " + "1.0")
    line = f.readline()

f.close()
こんな感じになりました。
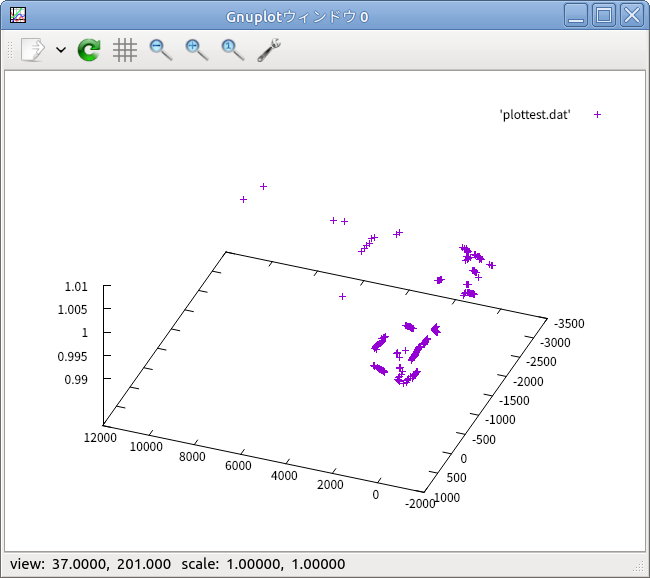
あぁ、LIDARを回した場所が悪かった・・・(^-^;
Tweet write: 2019/04/03/ 23:17:49